

This article provides further light on a topic addressed in Currency News™ last May, namely the development of the number of banknotes in circulation. The estimate then was like a first trial and resulted globally in 921 billion banknotes. It was based on data available at the time consisting mostly of end-2023 or 2024 figures.
After the publication, I received questions about whether data on the development of this figure can be provided. Given that not all central banks publish the relevant data, and even if they do publish they may use different concepts, the development of a global number requires a lot of tailor-made work and estimation. Therefore, this article will not provide any time series but an estimate at the end of three years at intervals of 10 years – 2004, 2014, and 2024 1.
Furthermore, this article will consider currency denomination structures at the respective three dates. Also, this topic was addressed last year, in the October 2025 issue of Currency News, using a different approach.
Why is it important to study the development of the number of banknotes in circulation?
First, even if most similar studies address the development of the value of banknotes in circulation, for the industry the volume development is much more important than the value. Optimally, the study should focus on the development of volume flows, like production, lodgments, withdrawals, processing and destruction of banknotes. However, the published coverage of these flows by central banks is inadequate for a global study the further into the past one goes.
Second, in a rapidly digitising world, one gets easily the impression that the role of banknotes as a form of money is fading away, which even by a casual study of developments is contrary to the truth.
In order to provide as realistic picture of the development of banknotes in circulation as possible, the target of the study is to focus on the number of banknotes that are ‘really in circulation’, ie. used for payments or as a store of value. This is somewhat challenging because of the use of different concepts by central banks.
Banknotes are a liability on the balance sheet of the issuing central bank. Central banks have different policies, how they manage this specific liability, and how the policy is reflected in their published balance sheets. In some cases, the policies have even changed in the course of time. The following policies can be identified: 1.Issued banknotes remain legal tender without limit and they are all included in the published banknote liability without separation of various series
2.Issued banknotes remain legal tender but (some) outdated types are separately shown in the published banknote liability – either in total or by individual denomination 3.Issued banknotes remain legal tender but (some) outdated banknote types are not included in the published banknote liability
4.Legal tender status is withdrawn regularly from outdated banknote types, but the central bank is still redeeming them, and they are included in the published balance sheet by individual denomination 5.Legal tender status is withdrawn regularly from outdated banknote types, but the central bank is still redeeming them, but they are not included in the published balance sheet 6.Legal tender status is withdrawn regularly from outdated banknote types, and they are no longer redeemed by the central bank, and therefore not included in the published balance sheet.
Accordingly, central banks use a multitude of different policies and concepts. For the purpose of the current study, published figures of the above categories 3, 5, and 6 are fully included in the volume numbers without any further analysis.
Regarding categories 2 and 4, the outdated banknote types published separately are not included in the study when there are only very minor changes in the annual figures, or the figures have fully stabilised. These notes – mostly found in death estates or similar – are in principle no longer really in circulation and hence they are excluded from the study. Examples of the impact of this exclusion regarding the Chinese, Indian, and Venezuelan notes were addressed in the May 2025 issue of Currency News.
Hence, it is mainly category 1 which may overestimate the numbers included in banknotes ‘really in circulation’. Some of these notes have been lost, burnt or taken abroad by tourists and seldom return.
These amounts differ by denomination, low denominations having a higher share. Other than that, these notes are impossible to count.
As a footnote, it is interesting to observe that most if not all reference books define demonetisation either ‘as a process in which a country’s currency unit is no longer legal tender, rendering it unusable for transactions’, or ‘no more legally considered exchanges and have no financial value’. The latter concept uses evidently a narrow concept of money, because so long as the central bank is redeeming the notes, they have financial value.
When providing examples of demonetisation, the mostly referred example is that in India in 2016, which was evidently much more than just the removal of the legal tender status. Besides that, the ₹500 and ₹1,000 banknotes lost their face value and became worthless as money and had only historical value.
In order to have a global figure for the number of banknotes in 2004, 2014, and 2024, the currencies of all 234 countries and dependent territories had to be included. However, only 155 currencies had to be addressed because the rest of the countries and territories use common currencies or currencies issued by another entity. Various methods were used to conclude the global numbers.
With the great support of several central bank colleagues, who kindly provided me with non-published data in addition to that which has been published, I had in conclusion figures from 112 currencies for all three dates 2004, 2014, and 2024. In spite of the different concepts addressed above, the handling of these figures was the easier part. More demanding was to estimate figures for those central banks which don’t publish regularly or not at all their number of banknotes in circulation.
Accordingly, at least part of the volume figures for 43 currencies had to be estimated. These currencies can be divided into three groups. The first group consists of currencies from which by way of an occasional report, interview, press release or conference presentation there is at least some denominational data. This group includes 24 currencies.
To calculate an estimate for all three dates for these 24 currencies, I proceeded as follows. As a first step, all currencies, both the 112 and 24, from which there were at least some data were classified at all three dates, based on the average value of a note in circulation within the size order of denominations (whether the average value was between the highest and second highest or second highest and third highest denomination etc). The result in all three dates is depicted in Figure 1.
According to Fig 1, the average value of a note has been located between the second and third highest denomination for a majority of currencies at all three dates. Furthermore, the average value has been generally increasing, which is understandable because of inflation.
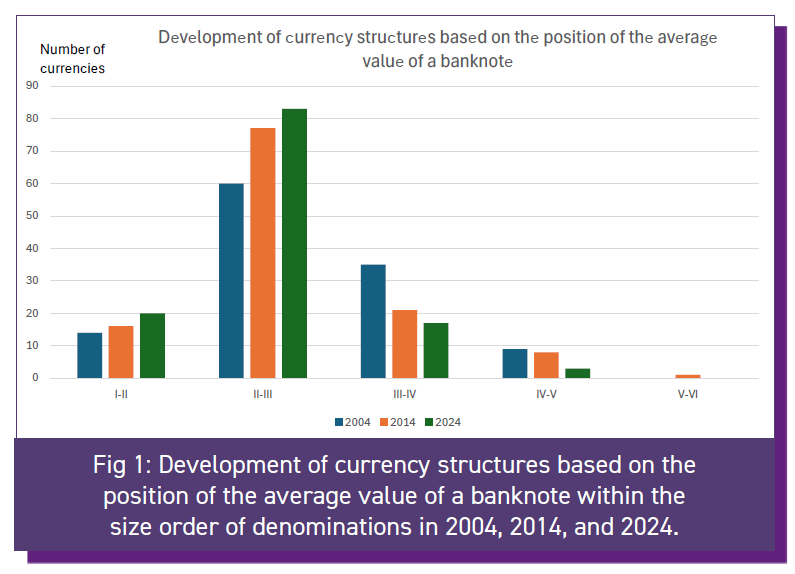
The currencies which had an average value of the note between the highest and second highest denomination were typically currencies which haven’t changed the denominational structure for quite a while. Because of gradual inflation, the popularity of the highest and second highest denomination had grown continuously, and the average value of a note had risen in the hierarchy above the second highest denomination. The graph shows that the incentive of central banks to issue new high-end denomination notes has decreased in the course of time.
Correspondingly, currencies which had the average value of a note between the third highest and fourth highest denomination were typically currencies which had recently issued a new highest denomination and had a diverse denominational structure. Other currencies belonging to this group were those which had a very popular lowest denomination.
Now, coming back to the 24 currencies from which I had certain denominational data and could therefore count the average value of a note at least at a certain date. I tried to put them into one of the aforementioned classes based on their properties, ie. whether their denominational structure had been stable, or a new high denomination had been introduced, or they had a popular lowest denomination. The average value of a note was estimated on that basis for all three dates and based on that the number of notes in circulation at the three dates (by dividing the value of banknotes in circulation by the average value).
The 19 currencies for which I had no volume data at all were divided into two groups. For most of them, at least value data on banknotes in circulation were available. Again, based on their denominational development they were classified. To reach a conservative estimate for the number of notes in circulation at
the three dates, the value of the second highest denomination was used for the average value (ie. dividing the value of banknotes in circulation by the value of the second highest denomination), in case the denominational structure indicated that the average value would have been between the second and third highest denomination and similarly with the other classes.
None of those currencies from which I had no volume data at all were issued by the 25 most populated countries of the world, and only four were among the 60 most populated. So, their importance to the final numbers was not significant. Anyway, the more information central banks will publish in the future, the more reliable the results will be.
Finally, there were a few currencies for which I couldn’t use this estimation method because no data was available on the value of notes in circulation. They were mainly very minor currencies, and a rough estimate was made looking at the printing volumes of their notes based on the serial numbers. Accordingly, at the very least a rough estimate on the number of notes in circulation could be reached for all 155 currencies, except the North Korean won.
The results of this study are depicted in Figure 2.
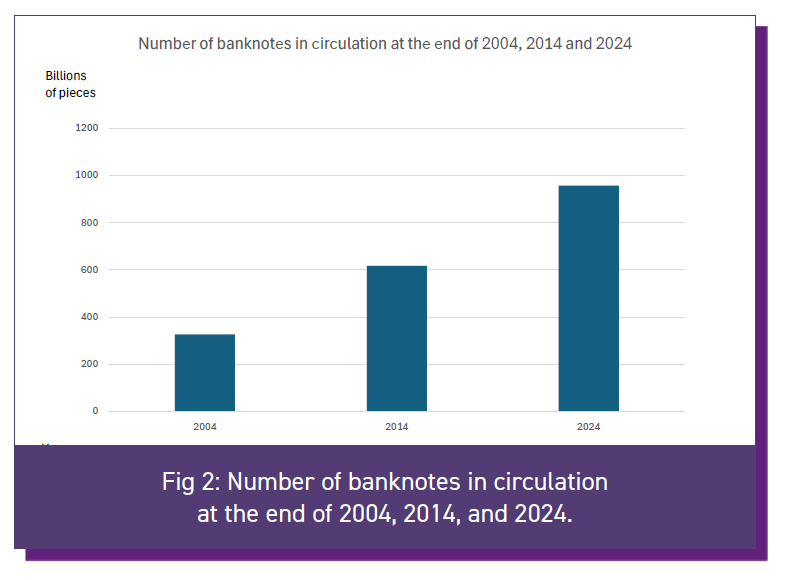
According to the study the number of banknotes at the end of 2004, 2014, and 2024 were respectively 325, 616, and 956 billion pieces. The percentual increase from 2004 to 2014 was 89%, and the respective increase during the more recent decade 55%. Hence, even if the growth rate has decreased, it has been on average 4.5% annually during the latter period.
Many reasons can be found for these growth rates.
One very obvious one is that even if the role of cash in transactions has been decreasing commonly, it is still the most prominent payment instrument in many countries, and the number of banknotes is growing at double digit rates. Even in countries where its transactional role is decreasing, its precautionary and store of value role is increasing in uncertain times.
Another factor is the introduction of more durable substrates to replace low-end paper notes instead of coins, which has meant that the note/coin boundary is changing no more than it used to do in the past 2.
The study, which is hopefully one step further in the analysis, has shown great positive development of the number of banknotes in circulation during two consecutive decades.
However, as mentioned the development of the volume flows is even more important to the future of cash infrastructure.
1 - Some central banks which regularly publish the volume figures haven’t yet published those for 2024. Then the last available figures were used, keeping the 10-year interval between the dates, if possible.
2 - See CN™ August 2025 issue for a detailed study.